How to Read Weather Charts: Understanding Isobars, Pressure, and Wind

Weather can influence nearly every part of a sailing trip, from the route you choose to the amount of sail you carry and whether conditions are appropriate for leaving the harbor at all. Learning how to read weather charts gives sailors a clearer picture of what the atmosphere is doing now and how conditions may change over the hours ahead.
By understanding basic features such as isobars, high- and low-pressure systems, fronts, and wind patterns, even beginner sailors can start making more informed decisions before getting underway.
This guide breaks down the essential elements of reading weather charts so you can approach marine forecasts with greater confidence.
What Is a Weather Chart?
A weather chart, sometimes called a surface weather map, is a visual representation of atmospheric conditions across a geographic area at a particular point in time. Rather than relying only on a written forecast, sailors can use these charts to see the larger weather systems that are influencing wind, pressure, precipitation, and changing conditions.
Marine weather charts commonly display features such as:
-
Isobars showing areas of equal atmospheric pressure
-
High- and low-pressure systems
-
Cold, warm, stationary, and occluded fronts
-
Wind direction and speed
-
Areas where changing or unsettled weather may develop
Learning how these features interact is an important part of understanding weather at sea.
Why Reading Weather Charts Is Important for Sailors
For sailors, weather affects much more than comfort. Changes in atmospheric pressure and the movement of weather systems can produce shifting winds, stronger gusts, rougher seas, reduced visibility, thunderstorms, and other potentially challenging conditions.
By reading weather charts before departure and comparing them with updated marine forecasts, sailors can gain useful insight into what conditions may be approaching. This information can help with decisions involving route planning, departure timing, sail selection, reefing, and whether a trip should be postponed.
Weather charts should not be treated as guarantees. Instead, think of them as one component of a larger weather-planning process that also includes official forecasts, observations, radar, satellite imagery, and conditions you experience on the water.
Understanding Atmospheric Pressure on a Weather Chart
One of the first concepts to understand when learning how to read weather charts is atmospheric pressure.
Atmospheric pressure is the force exerted by the weight of the atmosphere. On marine weather charts, pressure is generally expressed in millibars (mb) or hectopascals (hPa), which are numerically equivalent.
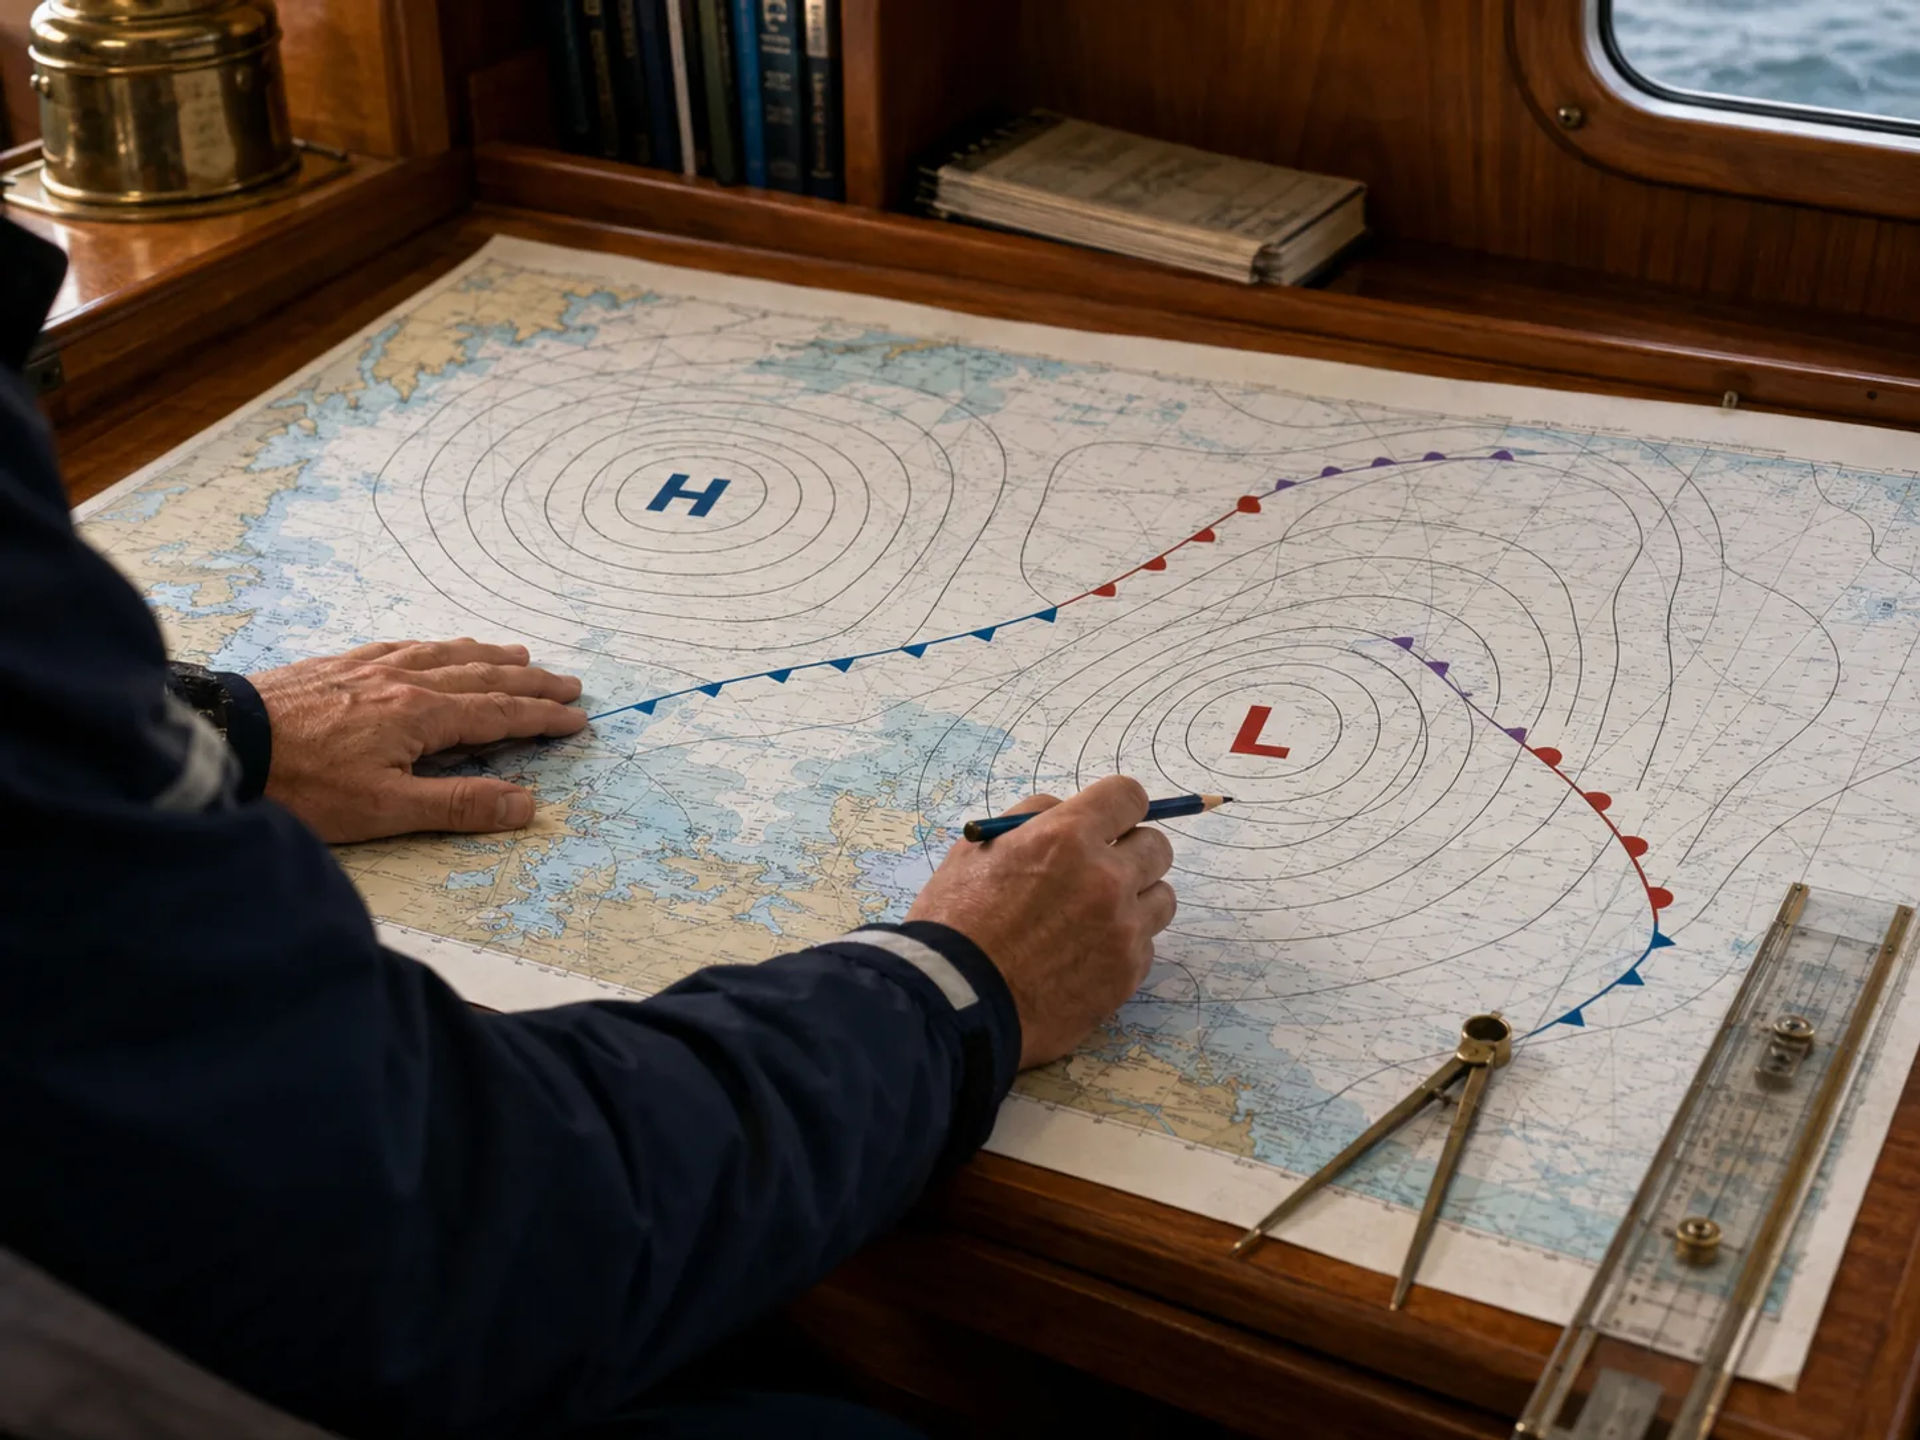
Changes in pressure help reveal the location and movement of larger weather systems.
High-Pressure Systems
High-pressure systems are typically marked with an "H" on weather charts. Air generally sinks within a high-pressure system, which often contributes to more stable weather.
Depending on the location and season, a high-pressure system may be associated with:
-
Clearer skies
-
Drier conditions
-
More stable weather
-
Lighter winds near the center of the system
In the Northern Hemisphere, winds generally circulate clockwise around high pressure.
Low-Pressure Systems
Low-pressure systems are normally marked with an "L." Rising air surrounding a low-pressure system can contribute to cloud formation, precipitation, and unsettled weather.
Sailors may encounter:
-
Increasing cloud cover
-
Rain or showers
-
Stronger or shifting winds
-
Frontal systems
-
More variable weather
In the Northern Hemisphere, winds generally circulate counterclockwise around low pressure.
The exact conditions depend on the strength, location, and movement of the system, so sailors should evaluate the entire chart rather than focusing only on the H or L symbol.
What Are Isobars?
Isobars are among the most important features to understand when reading weather charts.
An isobar is a line connecting locations that have the same atmospheric pressure. Weather charts usually contain numerous curved isobars surrounding areas of high and low pressure.
You can think of isobars somewhat like contour lines on a topographic map. Instead of showing elevation, however, they show pressure patterns.
The spacing between isobars provides especially useful information to sailors because it indicates the strength of the pressure gradient.
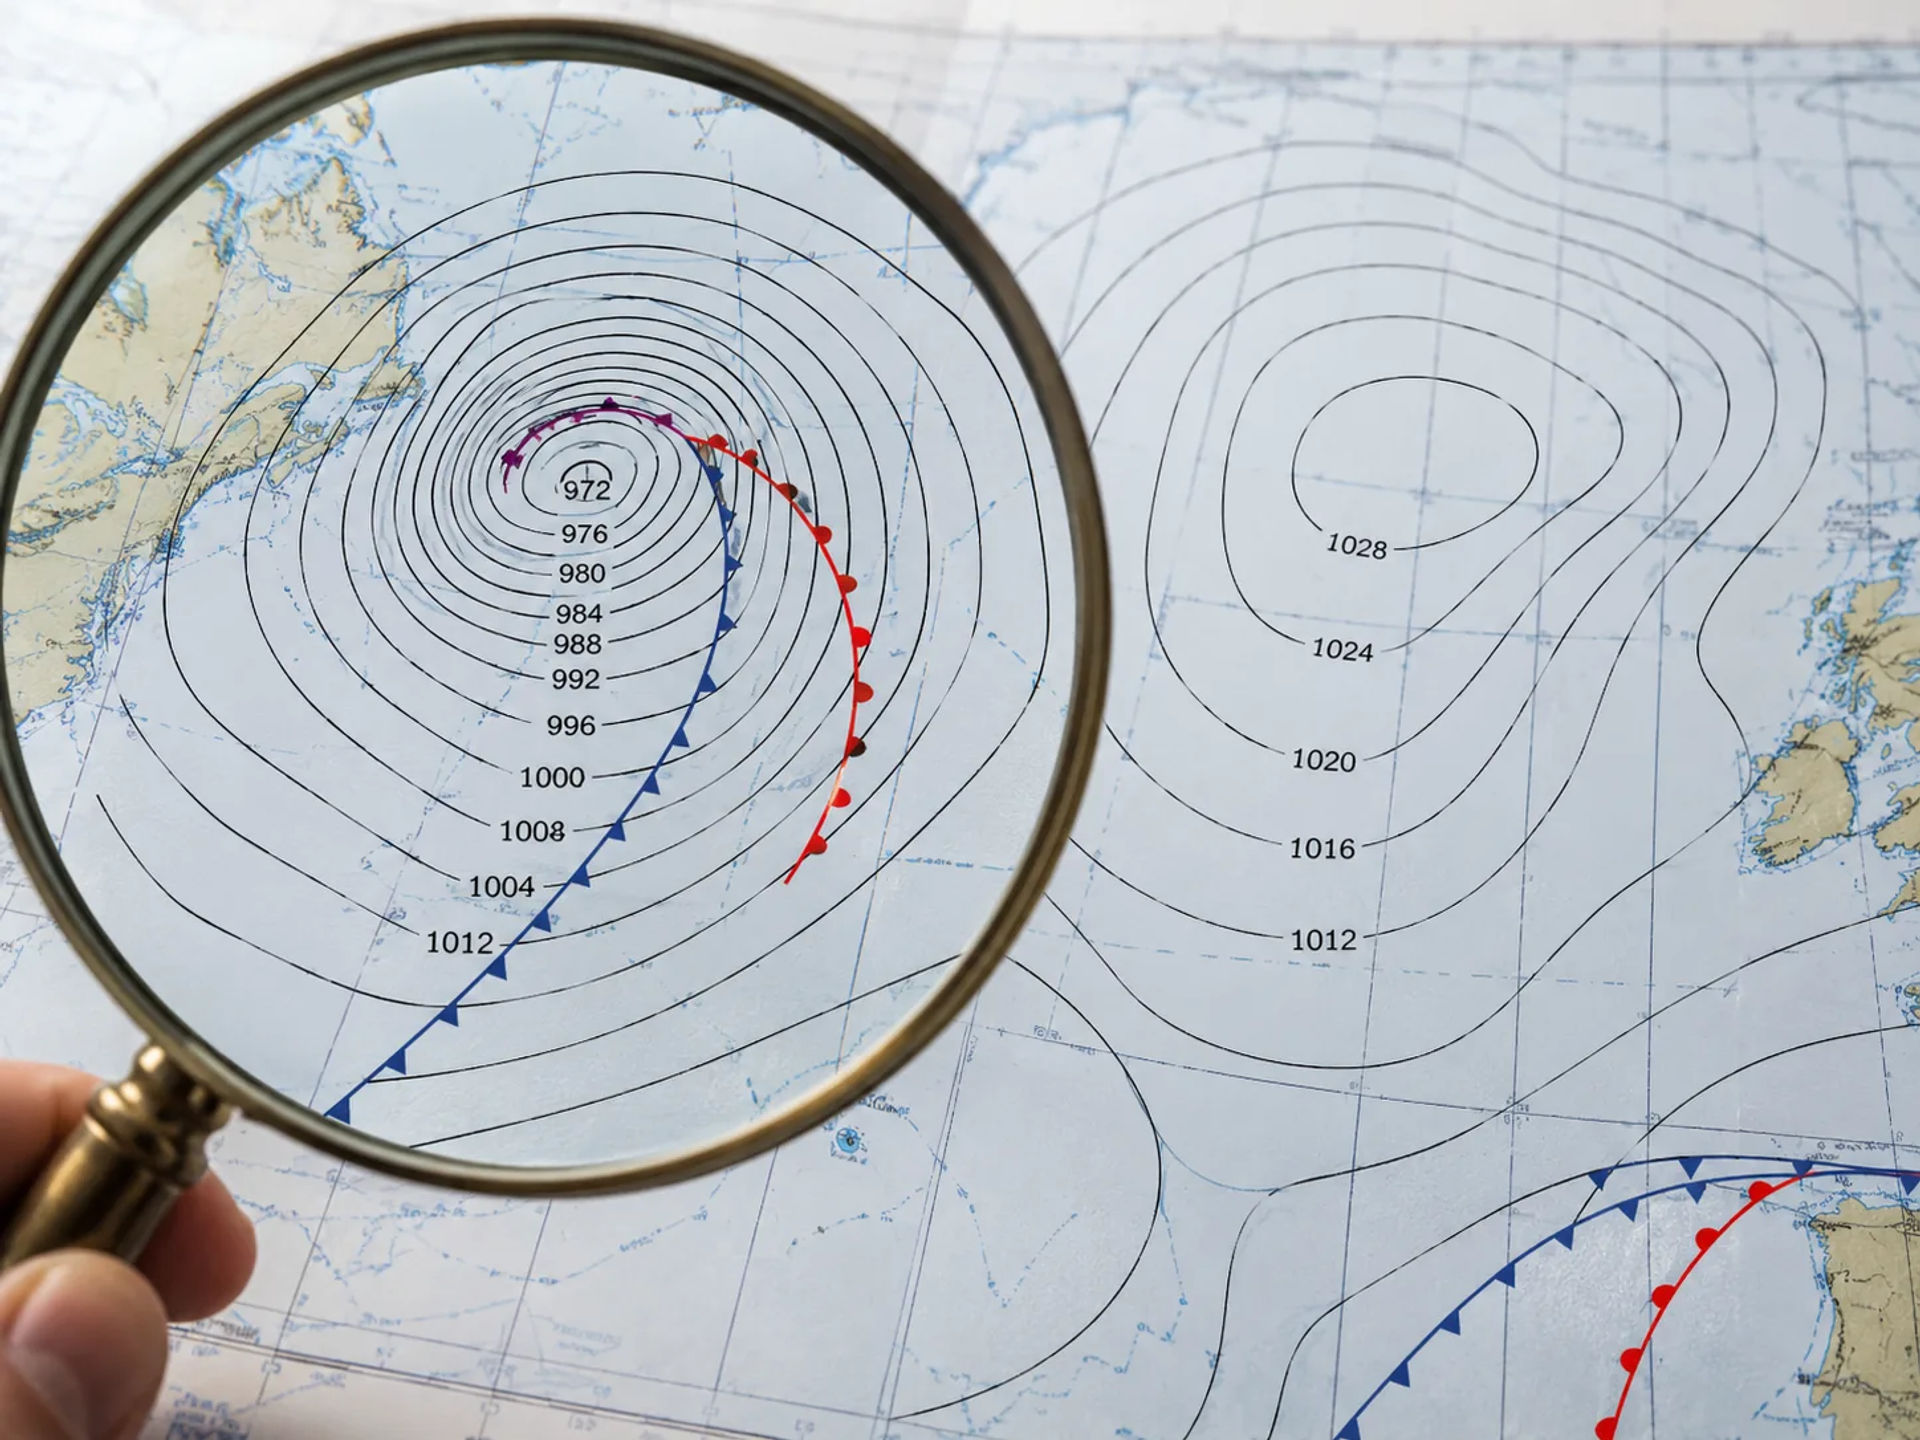
Closely Spaced Isobars
When isobars are packed closely together, atmospheric pressure is changing rapidly over a relatively short distance. This stronger pressure gradient is generally associated with stronger winds.
For a sailor, closely packed isobars should immediately attract attention because they may indicate conditions that require additional planning, reduced sail, or greater caution.
Widely Spaced Isobars
When isobars are farther apart, the pressure gradient is weaker. These areas are generally associated with lighter winds.
That does not automatically mean conditions will remain calm. Frontal passages, thunderstorms, local effects, and rapidly developing systems can still cause significant changes.
How Isobars Help You Estimate Wind
One of the most practical reasons for learning how to read weather charts is that isobars provide clues about expected wind.
Wind develops partly because air moves in response to differences in atmospheric pressure. In general, greater differences in pressure over shorter distances produce stronger winds.
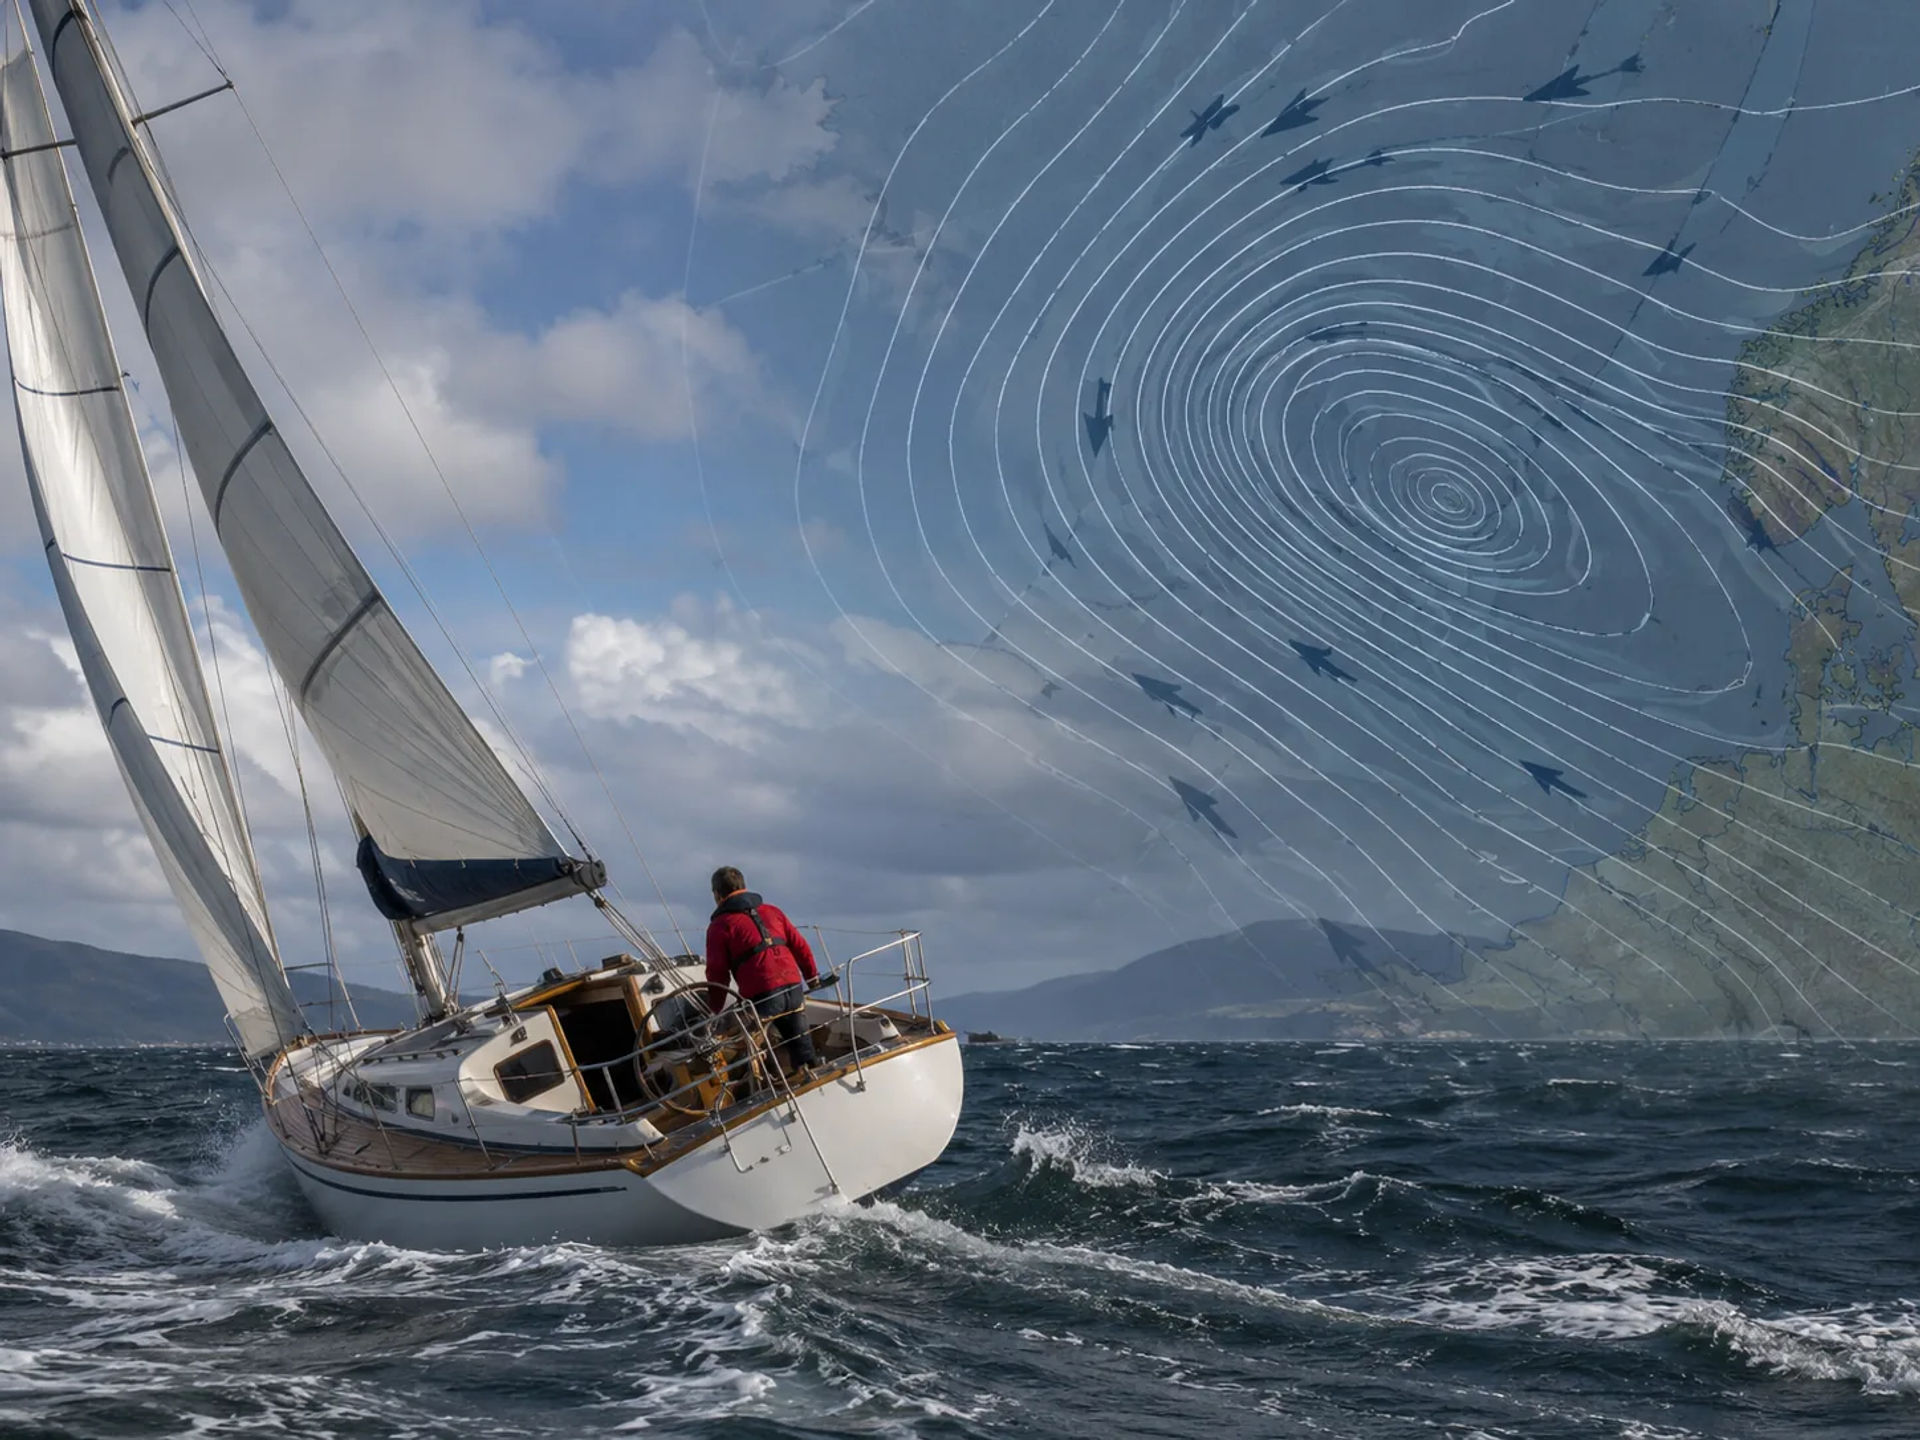
A basic rule for beginners is:
Tightly packed isobars = potentially stronger wind.
Widely spaced isobars = generally lighter wind.
The actual wind you experience aboard a sailboat will also be affected by friction, geography, local sea breezes, terrain, coastal effects, and other atmospheric factors.
Instead of trying to predict an exact wind speed based only on isobars, beginners should initially use them to recognize broader patterns and areas where stronger or lighter winds are more likely.
Understanding Wind Direction Around Pressure Systems
Pressure systems also provide useful clues about wind direction.
In the Northern Hemisphere:
-
Wind generally circulates clockwise around high-pressure systems.
-
Wind generally circulates counterclockwise around low-pressure systems.
The wind does not necessarily follow the isobars perfectly. Near the surface, friction causes the flow to cross isobars slightly toward lower pressure.
For sailors, however, the overall circulation pattern can help identify how the wind may change as a weather system moves through an area.
Suppose a low-pressure system is approaching your sailing area. By examining its location, movement, and surrounding isobars, you may be able to anticipate not only increasing wind but also a significant change in wind direction as the system passes.
How to Identify Weather Fronts
Weather charts frequently show fronts extending outward from low-pressure systems. A front represents a boundary between air masses with different characteristics.
Knowing how to recognize the major types of fronts is an essential skill when reading weather charts.
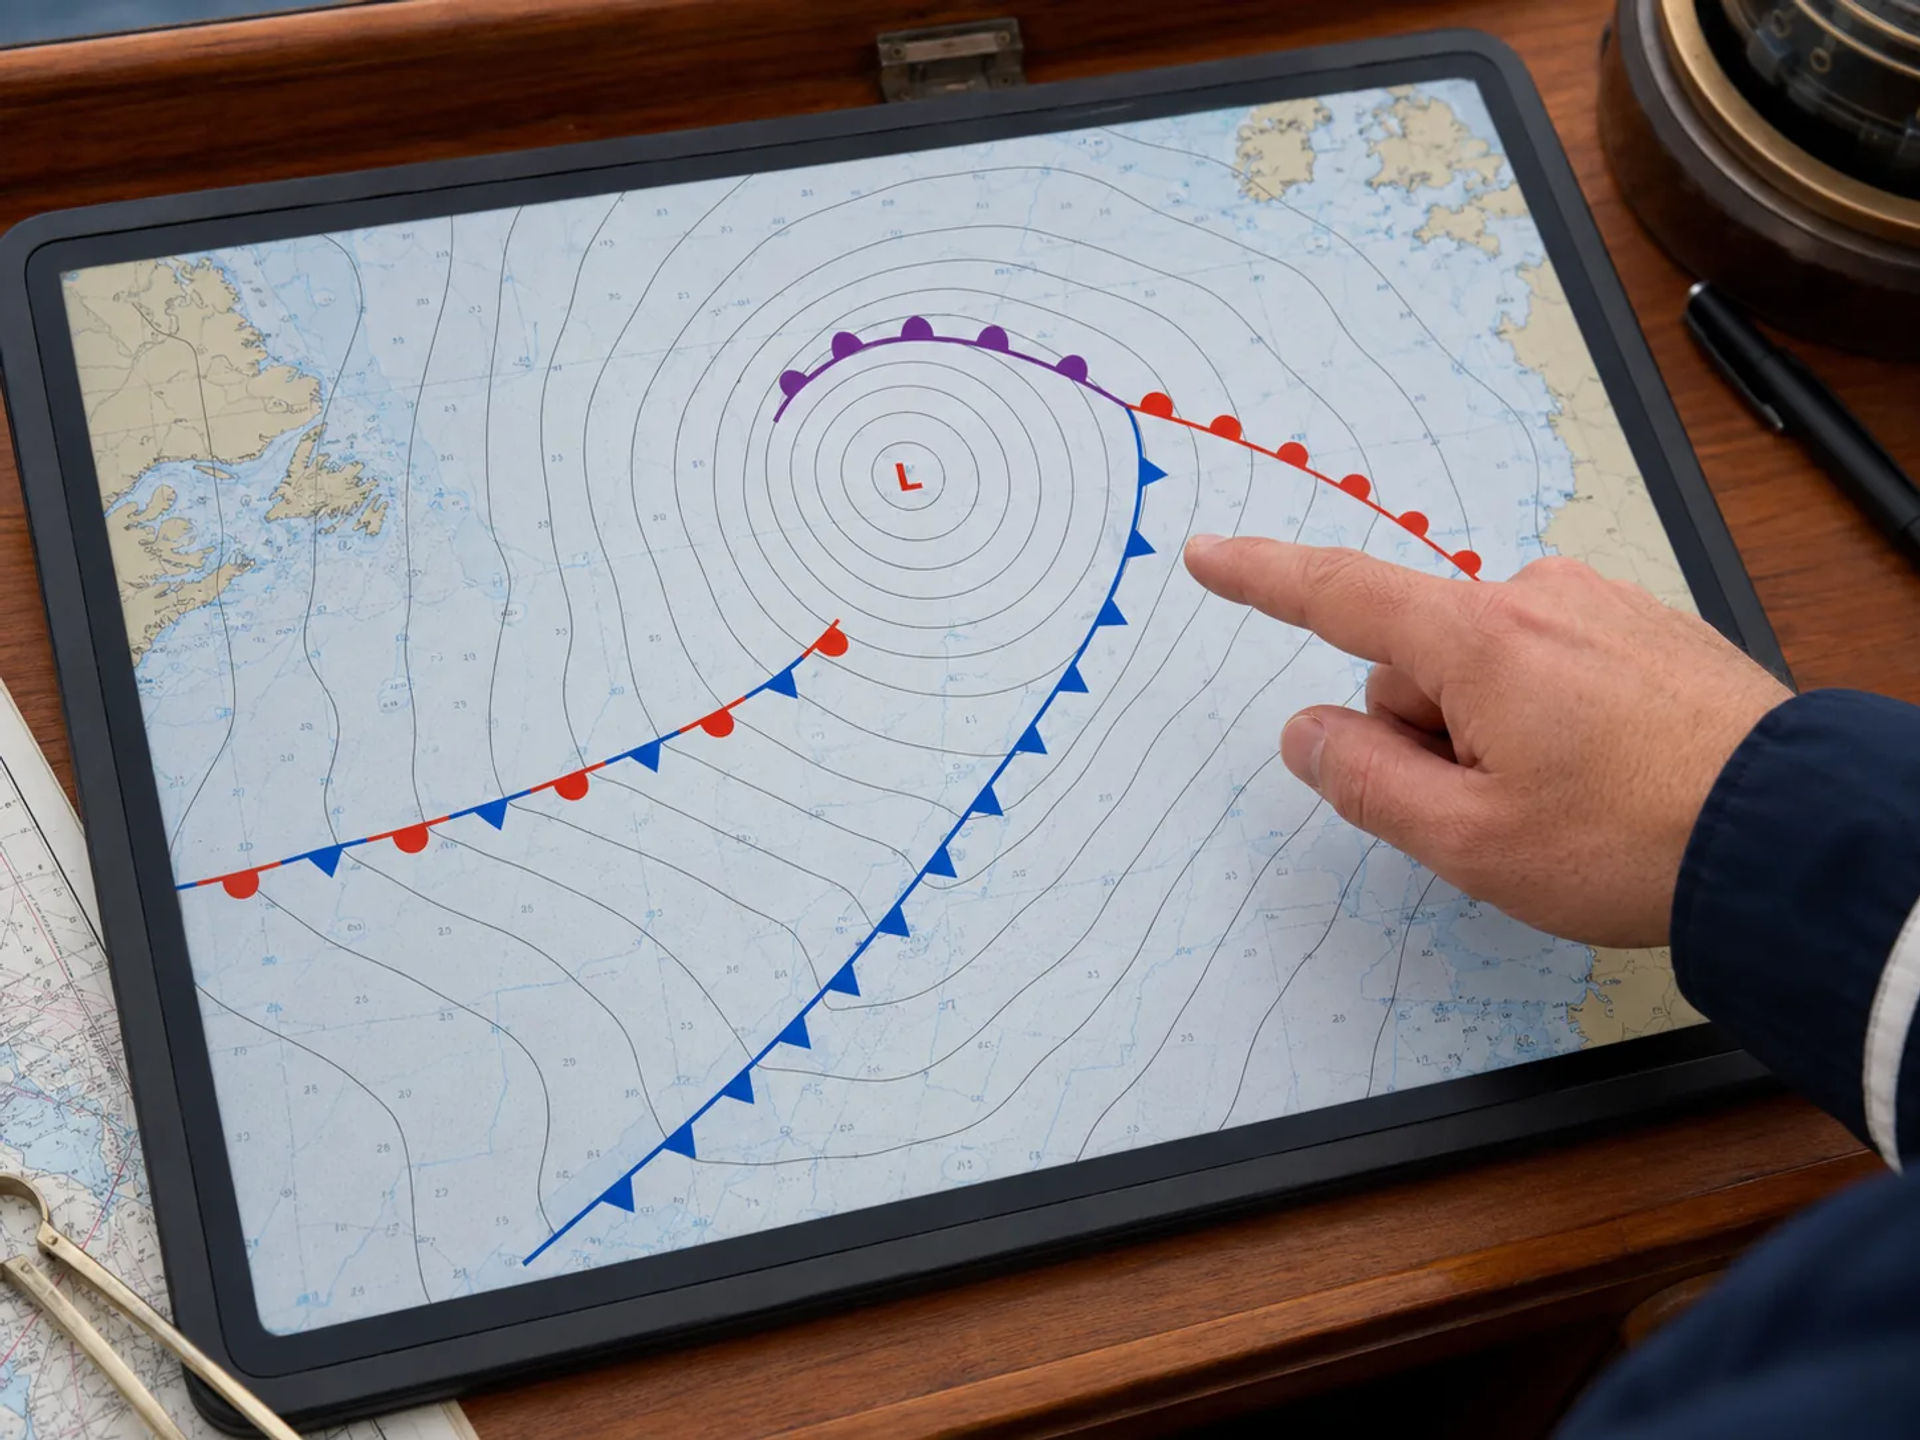
Cold Front
A cold front is typically displayed as a line with triangles pointing in the direction the front is moving.
Cold fronts occur when colder air advances and replaces warmer air. They can sometimes produce relatively rapid weather changes, including:
-
Wind shifts
-
Gusty conditions
-
Showers or thunderstorms
-
Falling temperatures
-
Changes in visibility
Sailors should pay close attention to approaching cold fronts because conditions can change quickly during frontal passage.
Warm Front
A warm front is normally displayed as a line with semicircles pointing in the direction of movement.
Warm fronts occur when warmer air gradually advances over cooler air. They may be associated with increasing clouds followed by steady precipitation and reduced visibility.
Weather changes surrounding a warm front are often more gradual than those associated with a cold front, although conditions can still have significant implications for sailors.
Stationary Front
A stationary front is represented by alternating triangles and semicircles on opposite sides of the line.
As the name suggests, the boundary is moving very little. Stationary fronts can result in prolonged cloudy or unsettled weather over the same general area.
Occluded Front
An occluded front is commonly shown using alternating triangles and semicircles on the same side of the line.
Occlusions develop when a cold front overtakes a warm front. They are often associated with mature low-pressure systems and may produce widespread clouds, precipitation, and changing winds.
Reading Wind Barbs on Weather Charts
Some marine weather charts include wind barbs that provide information about both wind direction and wind speed.
A wind barb consists of a line, or staff, with feathers or flags attached to it. The staff points toward the direction from which the wind is coming.
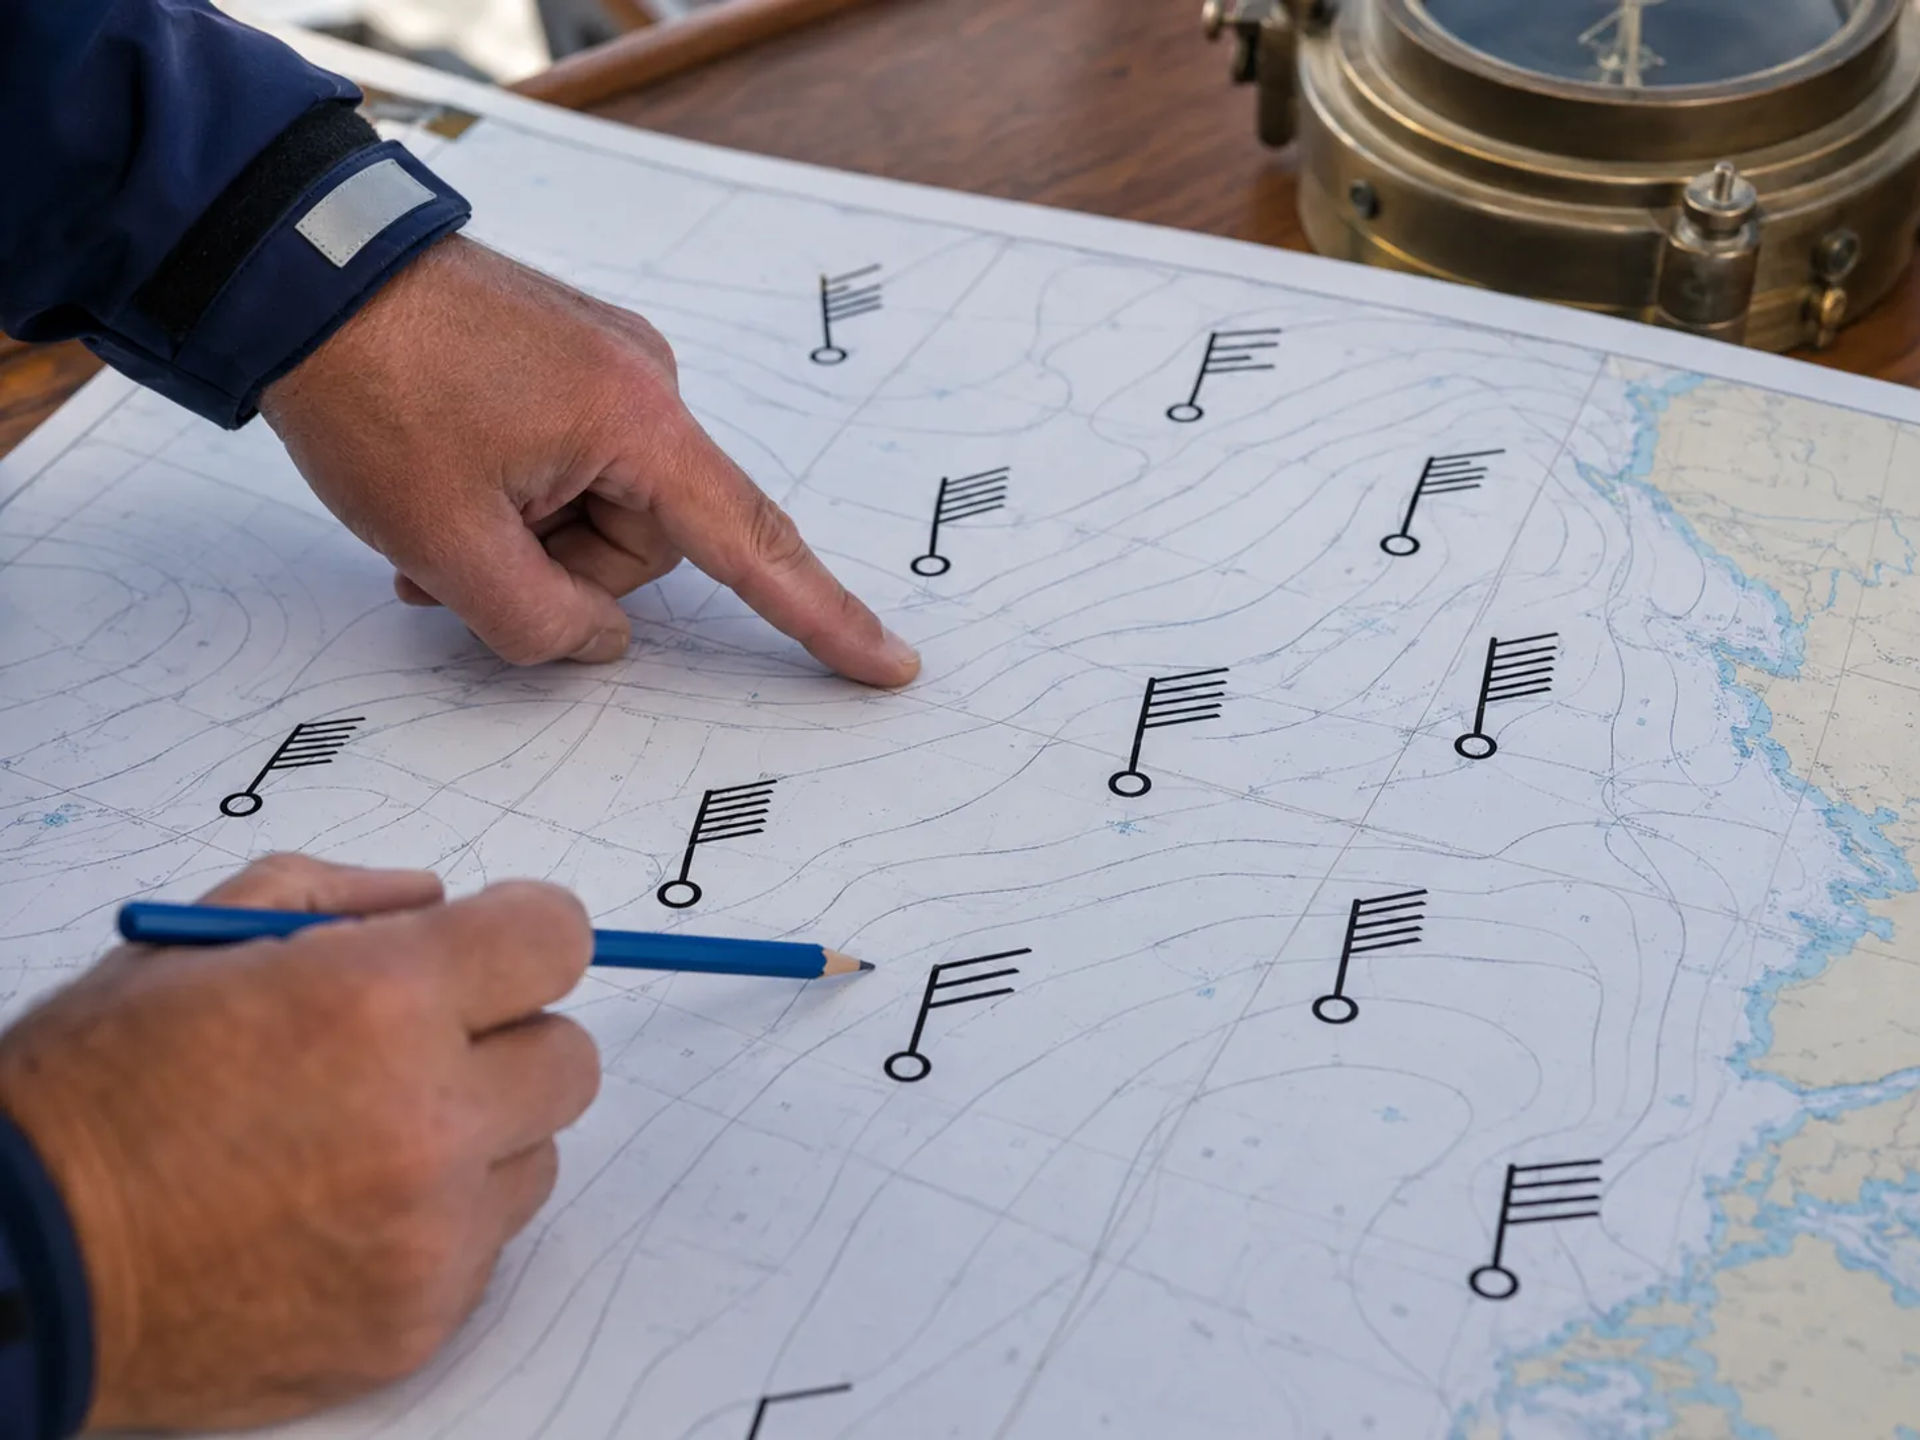
The feathers indicate wind speed in knots. Common conventions include:
-
A short barb representing 5 knots
-
A long barb representing 10 knots
-
A triangular flag representing 50 knots
The different markings can be added together. For example, two long barbs and one short barb indicate approximately 25 knots.
Learning wind barbs can initially feel unfamiliar, but with practice they become a quick way to interpret conditions across a large area.
Look at the Overall Weather Pattern First
A common beginner mistake is concentrating on one symbol without considering the larger weather system.
When learning how to read weather charts, begin with the big picture.
Ask yourself:
-
Where are the nearest high- and low-pressure systems?
-
Are they strengthening or weakening?
-
Where are the major fronts?
-
How tightly packed are the isobars?
-
What direction are the systems moving?
-
What weather features are approaching your sailing area?
Once you understand the broader pattern, you can focus more closely on your intended route.
This approach helps you understand not just what the weather is doing now, but why it is behaving that way.
Pay Attention to How the Chart Changes Over Time
A single weather chart provides only a snapshot. Sailors gain significantly more information by comparing several charts from different times.
For example, you may notice that:
-
A low-pressure system is moving closer to your route.
-
Isobars are becoming increasingly compressed.
-
A cold front is approaching the coastline.
-
A high-pressure system is moving away.
-
A previously weak system is strengthening.
These trends can be far more valuable than interpreting an isolated chart.
When possible, compare current observations with forecast charts covering the next several hours or days. This allows you to build a mental picture of how conditions are expected to evolve.
Consider Local Effects Along the Coast
Large-scale weather charts are extremely useful, but they cannot show every localized condition a sailor may experience.
Coastal areas can create their own wind patterns due to differences in temperature, terrain, and geography. Sea breezes, land breezes, headlands, valleys, islands, and mountains can all influence local wind direction and strength.
Around Southern California, for example, local coastal conditions may differ considerably from the broad pattern shown on a large regional weather chart.
For this reason, sailors should combine weather charts with local marine forecasts and current observations whenever possible.
A Simple Step-by-Step Process for Reading Weather Charts
Beginners can make reading weather charts easier by following the same process every time.
Step 1: Locate Your Sailing Area
Start by identifying your departure point, destination, and intended route.
Do not limit your attention to the exact location of your boat. Look far enough around the surrounding region to identify weather systems that could move toward you during the planned trip.
Step 2: Identify High- and Low-Pressure Systems
Find the H and L symbols and observe their position relative to your route.
Consider the likely circulation around those systems and whether they are moving toward or away from your area.
Step 3: Examine the Isobars
Look closely at the spacing of the pressure lines.
Closely packed isobars suggest a stronger pressure gradient and potentially stronger winds. Wider spacing generally indicates lighter conditions.
Step 4: Find Any Nearby Fronts
Identify cold, warm, stationary, or occluded fronts.
Pay particular attention to fronts expected to cross your route because they can produce wind shifts, precipitation, visibility changes, and rapidly changing conditions.
Step 5: Check Wind Direction and Speed
Use wind barbs or supplemental marine wind forecasts to estimate the wind conditions along your intended route.
Consider whether the expected wind direction will produce comfortable sailing conditions or create challenging seas.
Step 6: Determine How the Pattern Is Moving
Compare forecast charts or sequential observations.
A weather system that appears safely distant on one chart may become important several hours later.
Step 7: Compare the Chart With Official Marine Forecasts
A weather chart should never be your only source of weather information.
Before leaving the dock, compare your interpretation with current marine forecasts, warnings, advisories, radar, and other available weather data.
Learn How to Read Weather Charts at Naos Yachts in Marina del Rey
At Naos Yachts in Marina del Rey, we help sailors develop the knowledge and practical skills needed to make better decisions on the water. Our sailing school offers a wide selection of American Sailing and American Boating certified courses for students ranging from complete beginners to experienced sailors looking to strengthen specific areas of seamanship. Our course selection includes hands-on sailing instruction as well as online classes covering specialized topics such as coastal navigation, celestial navigation, radar, and marine weather.
For sailors who specifically want to become more comfortable interpreting weather information, our ASA 119 Marine Weather Endorsement is an excellent opportunity to expand your knowledge. Naos Yachts offers ASA 119 as part of its online American Sailing course selection, giving students an opportunity to build a stronger foundation in marine weather and better understand concepts that are important when learning how to read weather charts.

Build Better Marine Weather Skills With Naos Yachts
Learning how to read weather charts transforms a collection of unfamiliar lines and symbols into valuable information about pressure, wind, fronts, and changing weather systems. Once you understand isobars, pressure gradients, high- and low-pressure circulation, wind barbs, and frontal patterns, you can begin looking beyond today’s forecast and developing a better understanding of why marine conditions are changing.
The best way to improve is through continued study and regular practice. If you are ready to become more confident reading weather charts and interpreting marine conditions, contact us at Naos Yachts in Marina del Rey or book a sailing class directly online. Our wide range of American Sailing and American Boating courses—including the ASA 119 Marine Weather Endorsement—can help you expand your knowledge, strengthen your decision-making, and become a more capable sailor.
FAQs
How do you read a weather chart for sailing?
Start by locating high- and low-pressure systems, then examine the isobars, fronts, and wind indicators around your sailing area. When learning how to read weather charts, focus on how these features interact to influence wind strength, wind direction, precipitation, and changing marine conditions.
What do high and low pressure mean on a weather chart?
High-pressure systems are often associated with more stable weather, while low-pressure systems are more commonly linked to clouds, precipitation, stronger winds, and changing conditions. In the Northern Hemisphere, winds generally circulate clockwise around high pressure and counterclockwise around low pressure.
How can you tell wind speed from a weather chart?
Wind speed can often be estimated by looking at isobar spacing or by reading wind barbs when they are included on the chart. Closely packed isobars usually indicate a stronger pressure gradient and higher wind speeds.
What is the best way to learn how to read weather charts?
The best approach is to learn the basic symbols and then regularly compare weather charts with actual conditions. Formal marine weather instruction, such as the ASA 119 Marine Weather Endorsement, can also help sailors build a stronger understanding of pressure, wind, fronts, and forecasting.